
Your Kong dashboard shows 5xx errors climbing on one route. You know something broke, but not which request failed or why. A metric tells you that. For the why you need the request’s log line and its trace, and you want to click from one straight to the other.
This post wires all three into one Grafana for a Kong Gateway data plane on Kubernetes, managed from Konnect. You also get the fixes for three failures that give no error: a missing ServiceMonitor label, a label clash that hides your Kong services, and one dollar sign. The whole stack is in a public repository.
Versions used: Kong Gateway 3.16.0.1 · kube-prometheus-stack 92.21.1 (Grafana 13.3.0) · OpenTelemetry Collector 0.163.2 · Loki 3.6.11 · Tempo 2.9.0 · Grafana Alloy 1.21.3 · kind
How Kong sends metrics, logs and traces to Grafana
Two plugins do the work. The Prometheus plugin exposes metrics on the data plane’s Status API, a small HTTP listener (port 8100 here) separate from the proxy. Prometheus scrapes it. On Konnect that’s the only option: the plugin docs say you must use the Status API. The OpenTelemetry plugin pushes traces and access logs over OTLP (the OpenTelemetry protocol) to a Collector, which writes traces to Tempo and logs to Loki.
Grafana Alloy adds the pods’ raw output, where crashes land. I used it because it reads pod logs through the Kubernetes API, with no host paths to mount.
Why not one plugin? Since 3.14 the OpenTelemetry plugin can push metrics too, but Kong’s official Grafana dashboard reads the Prometheus plugin’s metric names.
Konnect has its own analytics (Konnect Observability); this stack is for when you want all three signals in your own Grafana. Already have an observability backend? Send the same data there.
Run the stack on kind
You need Docker with about 4 GB of memory, kind, kubectl, Helm, task, decK (Kong’s CLI for pushing config) and a Konnect personal access token. The data plane is one you run yourself, deployed with the kong/kong Helm chart.
git clone https://github.com/bhatikuldeep/kong-grafana-observability-stack
cd kong-grafana-observability-stack
cp .env.example .env
# put your token in KONNECT_TOKEN
task up
task test
task test sends traffic and asks each store whether its signal arrived. Traces wait about 10 seconds in the Collector before they’re written, so it retries for up to two minutes and exits non-zero if anything is still missing:
Not everything has arrived yet, retrying in 15s (1/8)...
=== TRACES (Tempo) ===
PASS: found 5 trace(s) for service.name=kong-gateway
=== LOGS (Loki, structured OTLP access logs) ===
PASS: found 5 log stream(s) for service_name=kong-gateway
=== LOGS (Loki, raw pod stdout via Alloy) ===
PASS: found 1 log stream(s) for namespace=kong
=== METRICS (Prometheus) ===
PASS: found 2 kong_http_requests_total series
=== Prometheus target health for kong job ===
  kong-kong-proxy  http://10.244.0.19:8100/metrics  health=up  lastError=
  kong-kong-proxy  http://10.244.0.20:8100/metrics  health=up  lastError=

All signals arrived.
Both commands print the Grafana address and login, and task clean removes everything, including the Konnect control plane.
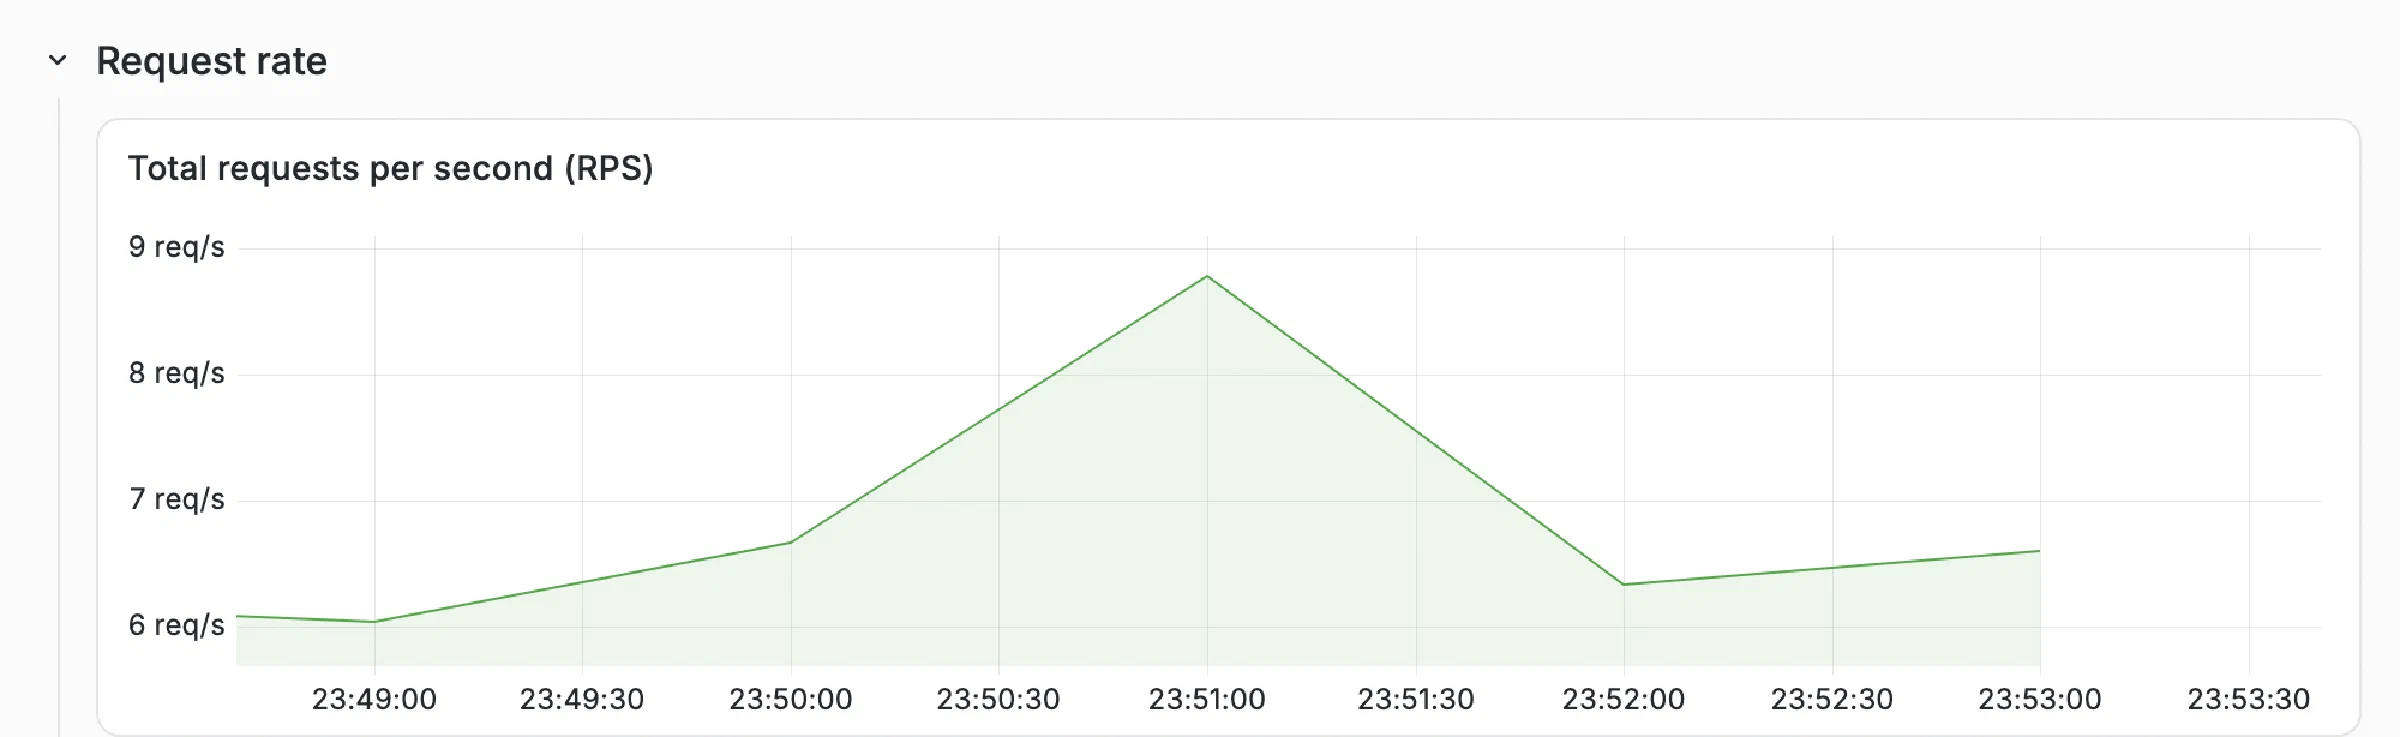
Open Dashboards > Kong > Kong (official) for request rates, status codes and latency per service and route:
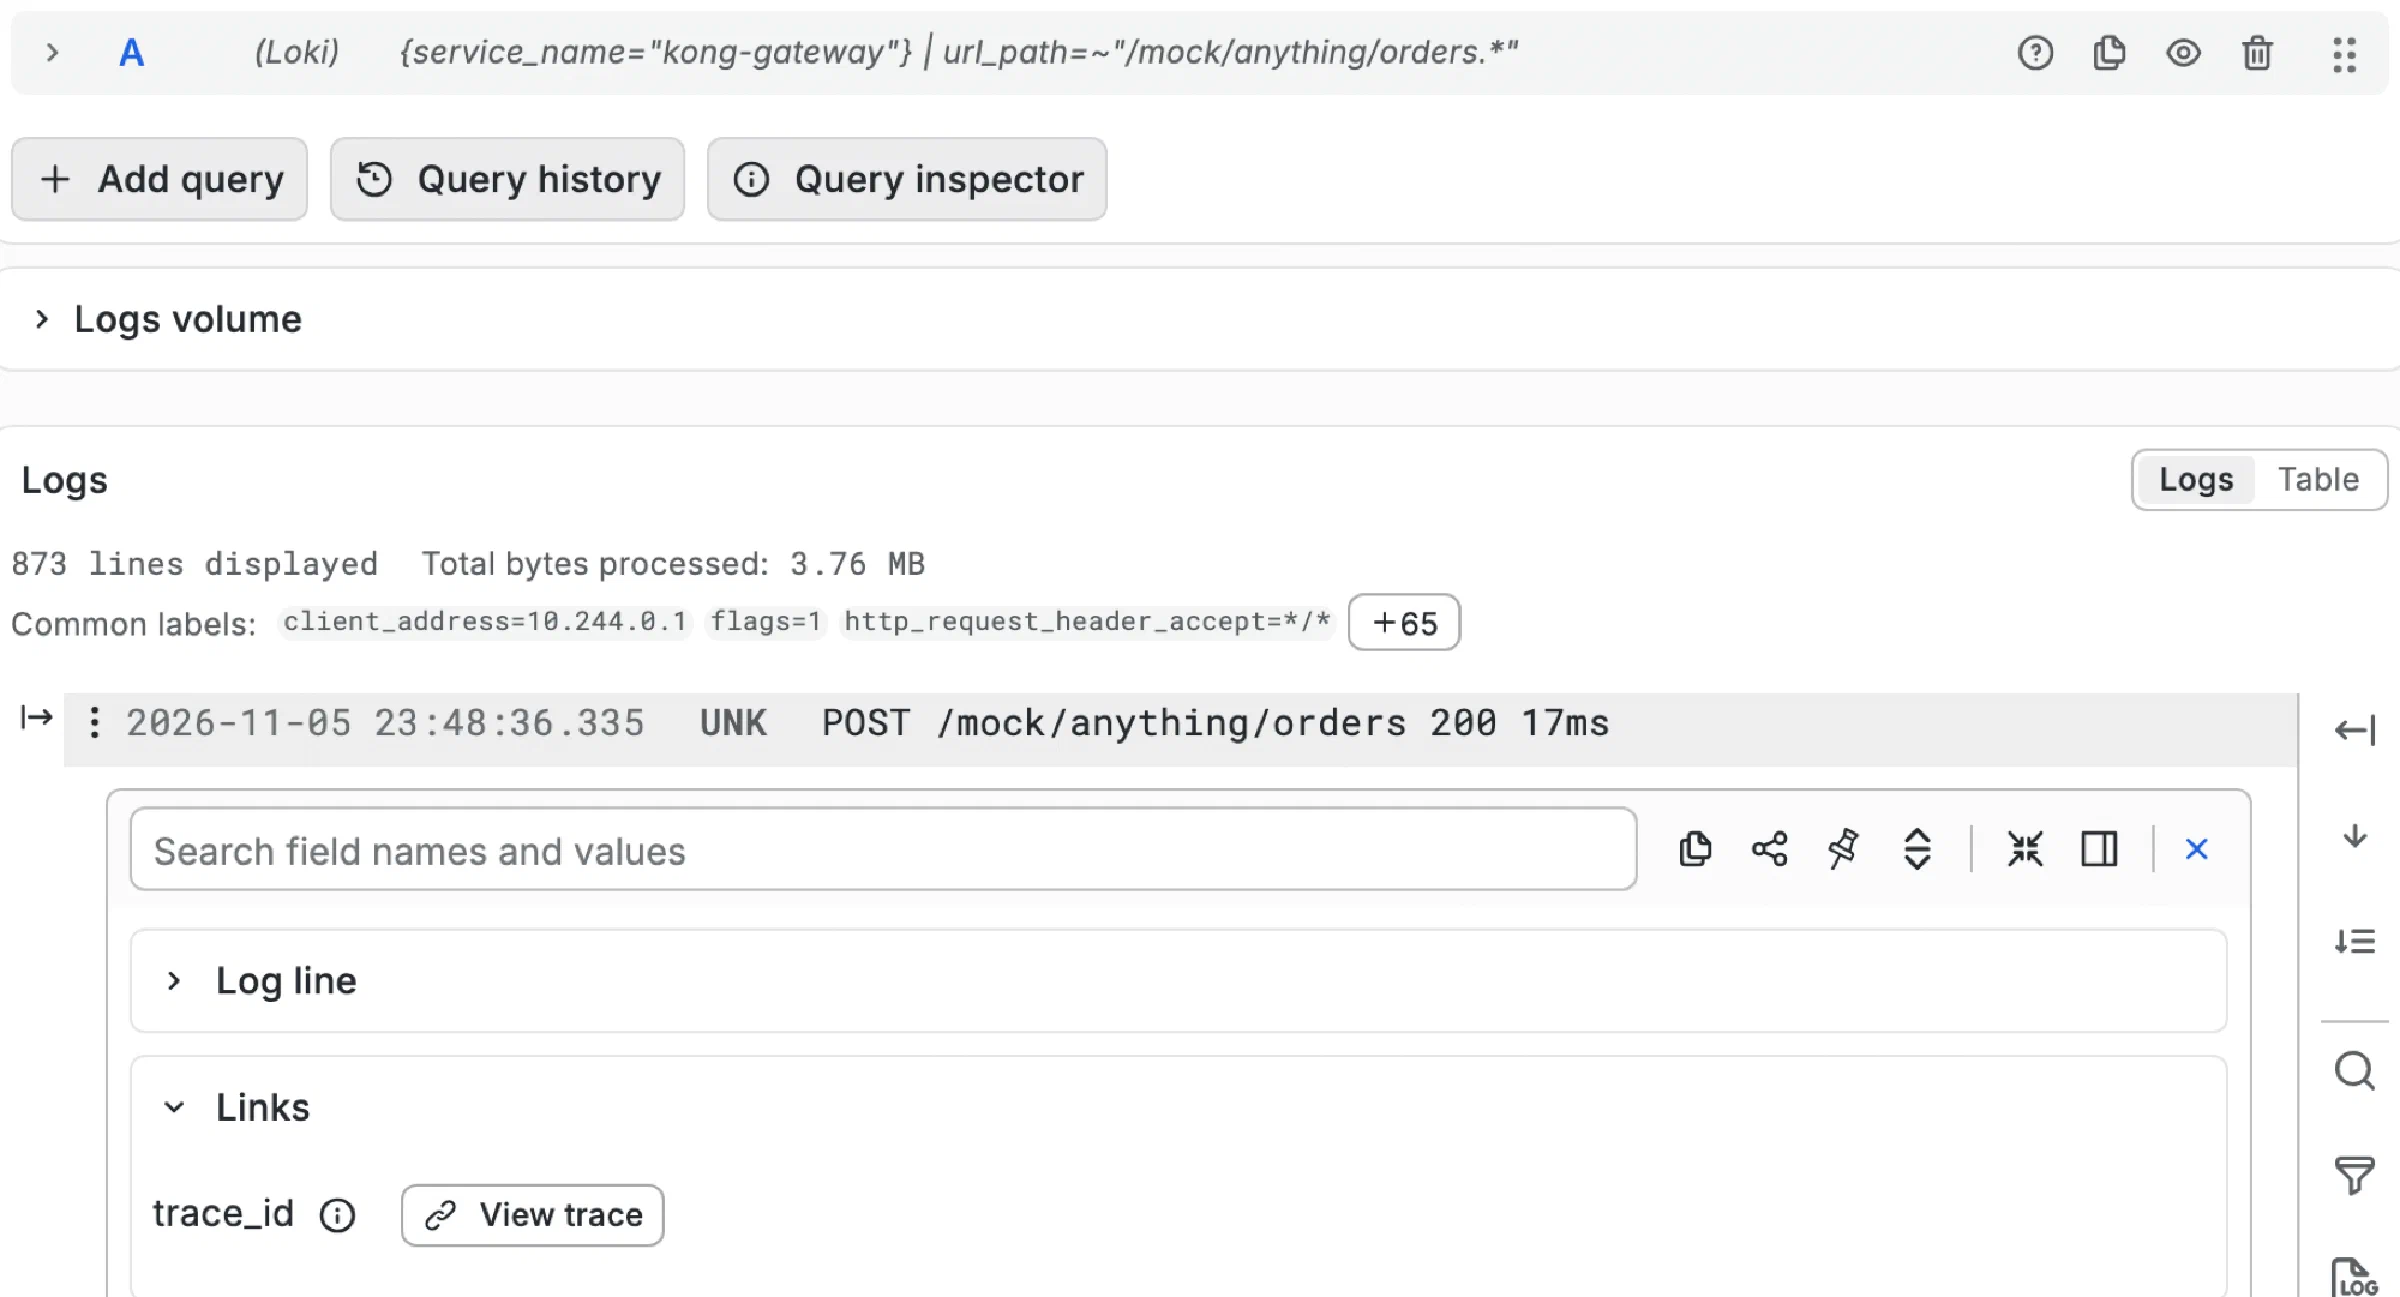
Then Explore > Loki with {service_name="kong-gateway"}. Each line is one request, and expanding it shows every field Kong logged, with a View trace link:
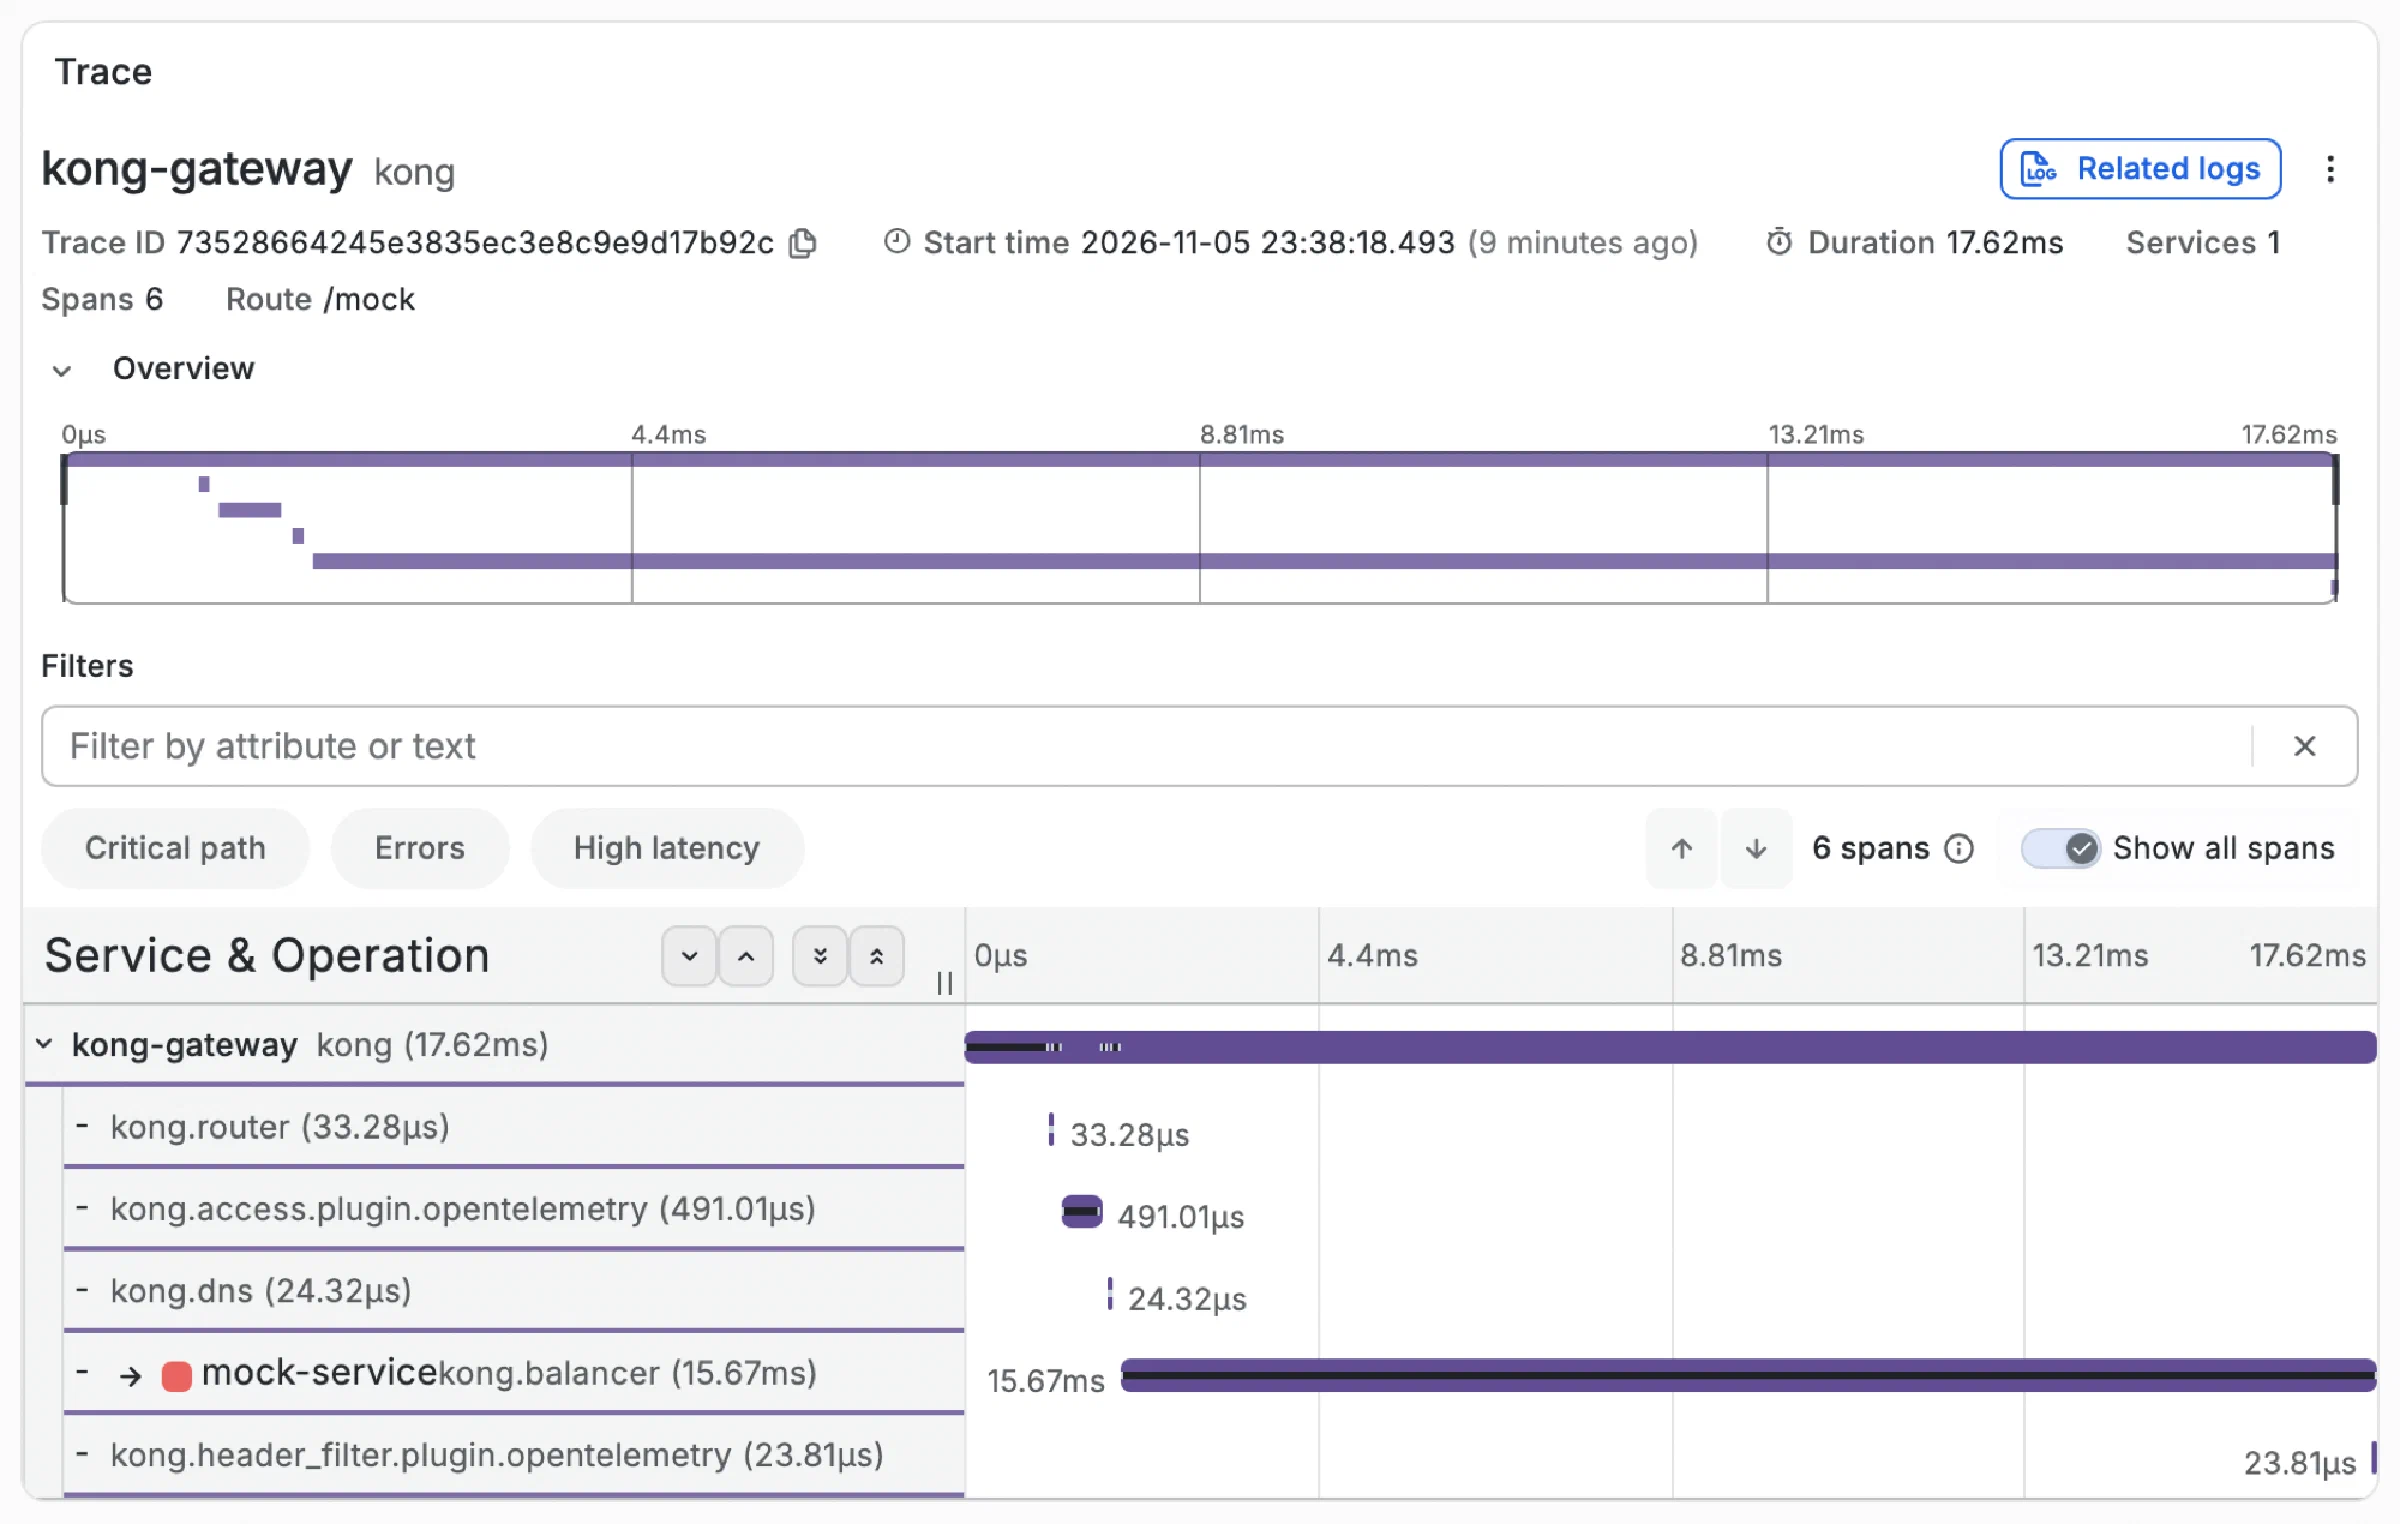
Select View trace and the same request opens in Tempo: six spans in 17.62 ms, almost all of it the balancer’s call to the upstream:
Leave the label off and nothing fails; the Kong target just isn’t there.
Configure the Prometheus and OpenTelemetry plugins
Both plugins are global on the control plane, so every route reports. In the repository, <collector> is the Collector’s Service, otel-collector-opentelemetry-collector.observability.
# kong.yaml (decK)
plugins:
  - name: prometheus
    config:
      status_code_metrics: true
      latency_metrics: true
      bandwidth_metrics: true
      upstream_health_metrics: true
  - name: opentelemetry
    config:
      traces_endpoint: http://<collector>:4318/v1/traces
      access_logs:
        endpoint: http://<collector>:4318/v1/logs
      resource_attributes:
        service.name: kong-gateway
The rest lives in the data plane’s Helm values. Tracing is switched on there, not in the plugin (prerequisites), and the Status API and ServiceMonitor come from the chart:
# values.yaml (kong/kong chart)
env:
  tracing_instrumentations: all
  tracing_sampling_rate: "1.0"
status:
  enabled: true
  http:
    enabled: true
    containerPort: 8100
serviceMonitor:
  enabled: true
  honorLabels: true
  labels:
    release: kube-prometheus-stack
A ServiceMonitor is a Kubernetes resource that tells the Prometheus Operator what to scrape. Access logs over OTLP need Kong Gateway 3.13 or later; on 3.13 the field is access_logs_endpoint, which 3.14 deprecates in favour of access_logs.endpoint.
service.name becomes the Loki label you query. Loki stores it as an index label and swaps the dot for an underscore (Loki OTLP docs), hence service_name.
Three silent failures and their fixes
No Kong metrics: add the release label. Prometheus only scrapes ServiceMonitors that match its selector, here release: kube-prometheus-stack. Leave the label off and nothing fails; the Kong target just isn’t there.
Every service is kong-kong-proxy: set honorLabels: true. This one caught me out. I had metrics, the dashboard drew lines, and I assumed the job was done until I picked a service from the drop-down and found only the Kubernetes Service name, the same for every Kong service. Series scraped through a ServiceMonitor get a service label with the Kubernetes Service name. Kong’s metrics already carry service, the Kong service name, so Prometheus renames Kong’s to exported_service. With honorLabels: true the scraped label wins (Prometheus honor_labels). It wins every clash, but Kong’s metrics carry no job or instance label, so here only service changes.
“View trace” opens an empty trace: escape the dollar sign. Grafana expands $VAR and ${VAR} in provisioning files as environment variables, so the link variable has to be written $${__value.raw} (Grafana provisioning docs). With one dollar sign the link renders with no trace ID.
Before production
- Kong samples every request (
tracing_sampling_rate: "1.0") and the Collector keeps every trace. For production, sample in the Collector: lower its baseline and keep errors and slow requests, so the traces you need are still there. - If the Collector is down, the plugin queues up to 10,000 entries and gives up on a batch after 60 seconds of retries (queue settings).
- Loki and Tempo run on local storage with no persistence. Use object storage and set retention.
- Access logs include request headers. Kong’s log serializer redacts
AuthorizationandProxy-Authorization, and on 3.16 anapikeyheader showed asREDACTEDtoo. ACookieheader went to Loki as sent. - The repository has an opt-in example (a
pre-functionplugin) that adds request and response bodies to the access log. Bodies hold tokens and personal data, so turn it on for one route, briefly, if at all.
What to do next
- If your Kong dashboard shows one service for everything, set
honorLabels: trueon the ServiceMonitor today. - To wire your own cluster, start from the Kong how-to for the OpenTelemetry side and copy the Helm values above.